BTC ETF Flows and Solana DeFi: The Indirect Connection
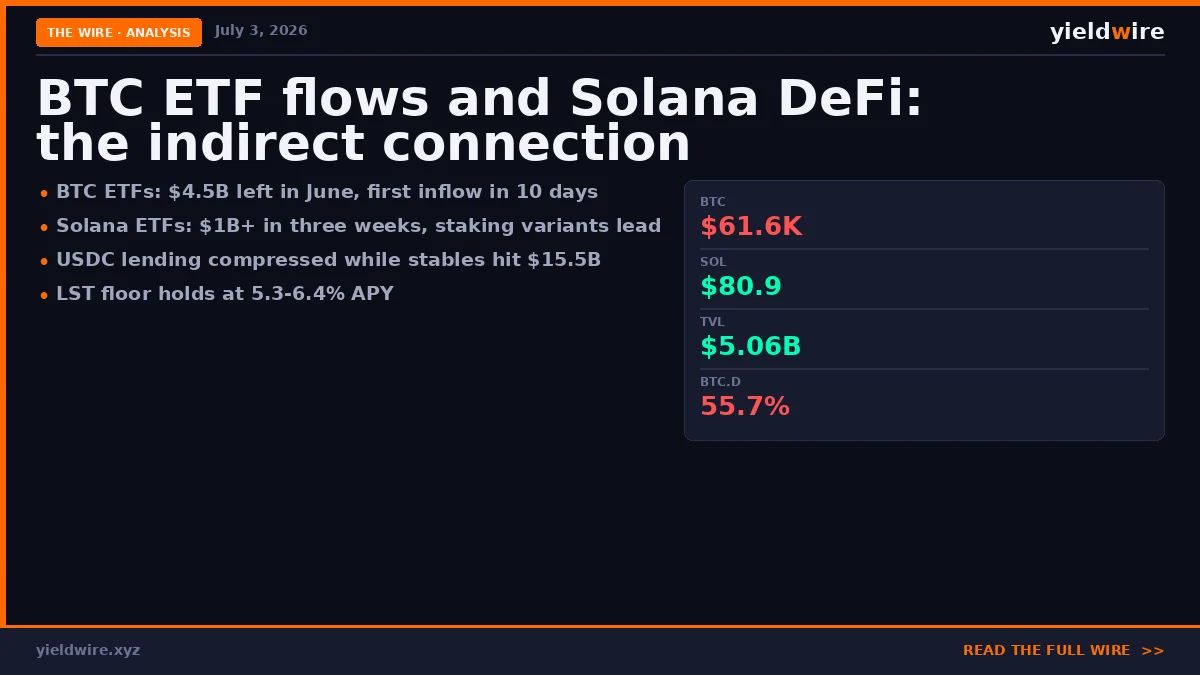
Bitcoin ETFs lost $4.5B in June and $2B in the past week alone, then broke a 10-day outflow streak with a $221M inflow on Thursday. Solana ETFs absorbed over $1B in three weeks during the same stretch. Here is how a Bitcoin product's flows end up moving Solana lending rates.
Two flow stories in the same week
US spot Bitcoin ETFs bled roughly $2.0B in the seven days through July 2. June as a whole saw more than $4.5B leave the products, and year-to-date net flows sit near negative $5.4B. Then Thursday broke the pattern: $221.7M came in, the largest daily intake in two months, ending a 10-day outflow streak. Fidelity's FBTC took nearly $166M of it while BlackRock's IBIT still logged a $40M outflow on the same day.
Solana ETFs spent those same weeks doing the opposite. The spot SOL products pulled in over $1B in three weeks through early July, with cumulative net inflows around $1.45B since their July 2025 launch. The staking variants take it further: Bitwise's BSOL stakes 100% of its SOL, and REX-Osprey's SSK was the first US fund to pass staking rewards through to holders.
Same wrapper, opposite directions. None of these funds touch a Solana lending market directly. Their flows still end up priced into the APY you see on a USDC deposit. Three channels do the transmission.
Channel 1: risk appetite sets borrow demand, borrow demand sets rates
Lending APY on Solana is utilization math. Borrowers pay, suppliers earn, and the rate moves with how much of the pool is borrowed. Most borrowing in DeFi is margin: loop a position, short an asset, farm a spread. When institutional flows turn negative and BTC slides from $67.3K in early April to around $61.6K today, traders unwind those loops. Borrow demand fades and supply rates follow.
You can see it in the USDC books. In early June the top of the market printed 8.47% on Loopscale and 8.21% on Kamino. Today the same markets pay 7.9% and 7.7%. The deepest pool tells the sharper story: Jupiter Lend's Earn vault holds $401M of USDC and pays 4.4%. Depositors kept supplying while borrowers stepped back, and the biggest market compressed hardest.
| Market | APY today | Early June | Net TVL |
|---|---|---|---|
| Loopscale USDC | 7.9% | 8.5% | $1.1M |
| Kamino Main USDC | 7.7% | 8.2% | $4.6M |
| Jupiter Lend Earn USDC | 4.4% | 3.8% | $401.2M |
| Save Main USDC | 2.4% | 2.1% | $6.6M |
Data: DeFiLlama, July 3, 2026. Net TVL is supplied minus borrowed.
A 50 to 60 basis point drift at the top of the book in four weeks is not a crash. It is consistent, though, with a month where the loudest institutional signal in crypto was money leaving. Rates compressed during the exact window the ETF outflows ran.
The mechanism runs on a lag, which is what makes it tradeable as a signal. ETF flow data prints daily. Utilization on Solana lending markets adjusts over days to weeks as positions unwind or rebuild. If you watch the flow data, you are effectively watching next month's lending rates form. That relationship held through the 2024 ETF launch cycle, through the 2025 expansion, and it is holding now in reverse.
Channel 2: the stablecoin buffer
Solana holds about $15.5B in USD stablecoins right now, near the highest it has ever been. That number matters because of what it says about where sold risk went. Capital that exits SOL or closes a margin position does not necessarily exit the chain. A lot of it parks in USDC and waits.
Parked stablecoins press on lending rates from the supply side: more USDC sitting in lending markets chasing fewer borrowers. That is the second half of why the deep pools pay 4.4% instead of 8%. But the same buffer is what makes recoveries on Solana fast. Rotation back into risk from an on-chain stablecoin is one transaction. Rotation back from a brokerage account is not.
Rising stablecoin supply plus falling rates is not a healthy yield environment. It is a loaded one. We track the supply split on the stablecoins page.
Channel 3: the SOL ETF counter-flow and the staking floor
The $1.45B that flowed into SOL ETFs while the token fell is the strangest data point of the quarter. Allocators kept buying a product whose underlying dropped, which reads as infrastructure positioning rather than momentum chasing.
For DeFi, the staking ETFs are the ones that matter. Funds that stake 100% of holdings compete for the same validator yield that backs every liquid staking token on the chain. Institutional products are now underwriting the 5% to 6.5% SOL staking band as an acceptable core return, and that band is the floor every other Solana yield prices against.
| LST | APY | TVL |
|---|---|---|
| mSOL (Marinade) | 6.4% | $196M |
| INF (Sanctum) | 5.8% | $164M |
| jupSOL (Jupiter) | 5.6% | $431M |
| JitoSOL (Jito) | 5.4% | $810M |
| bSOL (BlazeStake) | 5.3% | $74M |
Data: DeFiLlama, July 3, 2026. Full list with risk scores on the liquid staking category.
When a lending market pays 4.4% on USDC and staked SOL pays 5.4% to 6.4%, the relative trade shifts, with the caveat that one carries SOL price exposure and the other does not. Yield only means something risk-adjusted, which is what our security scoring exists for.
What the TVL is doing underneath
Solana DeFi TVL sits at $5.06B today against $4.66B a week ago, a gain of about 8.6%. Some of that is price: SOL moved from $71.7 to $80.9 over the past 30 days, and USD-denominated TVL inflates with it. The 90-day view is more sober. TVL was $5.35B in early April, so the chain is still below its spring level even after the weekly bounce.
BTC dominance at 55.7% completes the picture. Dominance climbing while BTC itself falls means altcoins fell faster, which is the textbook risk-off pattern. Solana DeFi did not escape it. It just cushioned it better than most, partly because the stablecoin base kept growing through the drawdown.
What to watch from here
Whether Thursday's $221M inflow was a turn or a blip decides the next leg for Solana yields. Three signals, in order of how early they move:
BTC ETF flows going green for two consecutive weeks. One day proves nothing after a 10-day streak the other way. Sustained inflows historically precede margin appetite returning, and borrow demand is what reflates lending APYs. Watch the deep pools first: Jupiter Lend's 4.4% has more room to reprice than Loopscale's 7.9%.
BTC dominance rolling over from 55.7%. Dominance falling while total market cap holds or rises means rotation into alts, and Solana has captured an outsized share of that rotation in every cycle since 2023.
Stablecoin supply on Solana continuing to climb. If the $15.5B keeps growing while rates stay low, capital is positioning ahead of demand. That gap usually closes in one direction.
The connection between a Bitcoin ETF and your Solana yield is indirect, but it is not weak. Flows set risk appetite, risk appetite sets borrow demand, and borrow demand sets the rate you earn. Compare the current numbers across every protocol on the yields dashboard, or model a position with the calculator.
Nothing here is financial advice. Every yield on this page carries protocol risk, and the rates shown are variable and already different by the time you read this.
Track all Solana yields in real time
Compare APYs across lending, LP, and liquid staking protocols on the YieldWire dashboard.
Open Dashboard →