Mid-July 2026 Yield Report: What Changed in Two Weeks
Solana TVL moved 1% in two weeks. The rates underneath moved a lot more. Jupiter's USDC rate fell as deposits arrived, Kamino's rose as they left, mSOL jumped 157 basis points, and an Orca pool shed 107 points of headline APY without losing a dollar of liquidity. The biweekly data snapshot, with the two-week deltas.
The headline number is boring on purpose
Solana DeFi TVL went from $4.81B on June 29 to $4.86B today. Up 1.0% in two weeks. If you only read the chart, nothing happened.
Four things happened.
Jupiter's USDC lending rate dropped 67 basis points while its deposits grew 5.5%. Kamino's flagship USDC market did the exact opposite. mSOL added 157 basis points of yield and became the best-paying major LST on the chain. And Orca's SOL-USDC pool lost 107 points of headline APY while its liquidity sat still.
Every one of those is a rate story, not a TVL story. The chain-level number hides all of them.
All figures below are pulled from DeFiLlama live, dated June 29 against July 13. Two-week windows, not 24-hour noise.
Stablecoin lending: the rate follows the deposits
The cleanest signal of the fortnight sits in USDC.
| Pool | June 29 | July 13 | Δ APY | TVL now | Δ TVL |
|---|---|---|---|---|---|
| Jupiter Lend USDC | 5.14% | 4.46% | -0.67pp | $417.4M | +5.5% |
| Jupiter Lend JUPUSD | 5.04% | 5.11% | +0.07pp | $71.3M | -3.4% |
| Kamino Lend USDC (main) | 3.90% | 4.04% | +0.14pp | $14.5M | -22.2% |
| Jupiter Lend USDT | 2.83% | 3.29% | +0.46pp | $17.4M | -4.5% |
| Unitas SUSDU | 9.97% | 9.97% | 0.00pp | $7.6M | +0.0% |
Read the first and third rows together. Jupiter took in more USDC and paid less for it. Kamino's main market lost more than a fifth of its supply and had to pay more. That is a utilization curve doing its job in public. Supply climbs, utilization falls, the rate falls with it. Supply leaves, utilization tightens, the rate climbs.
The practical version: chasing the top-of-table rate on a pool that just absorbed a wave of deposits is chasing a number that is already gone. The rate you see is the rate the last depositor killed.
Unitas SUSDU sits at 9.97%, unchanged, and it is the highest stablecoin rate on Solana by a wide margin. It also holds $7.6M. That is a rounding error next to Jupiter's $417M. A 10% rate on a pool that thin is a position-sizing question before it is a yield question. Check it on the risk filter before you size into it.
Note also what did not move. BlackRock's BUIDL ($630.5M) went 3.51% to 3.44%. Ondo's USDY ($181.4M) sat at 3.55% both days. Tokenized treasuries are the control group in this experiment: same asset, same rate, no drama. They are the floor everything else gets measured against, and they tell you the DeFi premium on USDC lending right now is roughly 90 to 100 basis points. Not the 400 the top-of-table numbers imply.
Two protocols hold 89% of Solana lending
Solana lending TVL is $2.22B across 27 protocols. Here is where it actually sits.
| Protocol | Solana TVL | Share |
|---|---|---|
| Kamino Lend | $1,011.4M | 45.5% |
| Jupiter Lend | $969.0M | 43.6% |
| Loopscale | $78.1M | 3.5% |
| Save | $67.1M | 3.0% |
| Project 0 | $55.0M | 2.5% |
| marginfi Lending | $32.4M | 1.5% |
| Everything else (21 protocols) | ≈ $9.0M | 0.4% |
Kamino and Jupiter hold 89.1% between them. The other 25 protocols split 11%.
This is why the Jupiter and Kamino rate divergence above is not a curiosity. When two venues hold nine tenths of the supply, their utilization curves are the Solana stablecoin lending market. There is no deep third pool to arbitrage the gap. If both tighten at once, everyone repricing borrows feels it at the same time.
Concentration is a risk input, not a headline. We score it on every protocol page, and it is one of the six factors in the security methodology.
Liquid staking: mSOL breaks from the pack
The LST sector holds $4.68B across 36 tokens. DeFiLlama counts it separately from the headline chain TVL, which is why the two numbers above look inconsistent and are not.
| LST | June 29 | July 13 | Δ APY | TVL now |
|---|---|---|---|---|
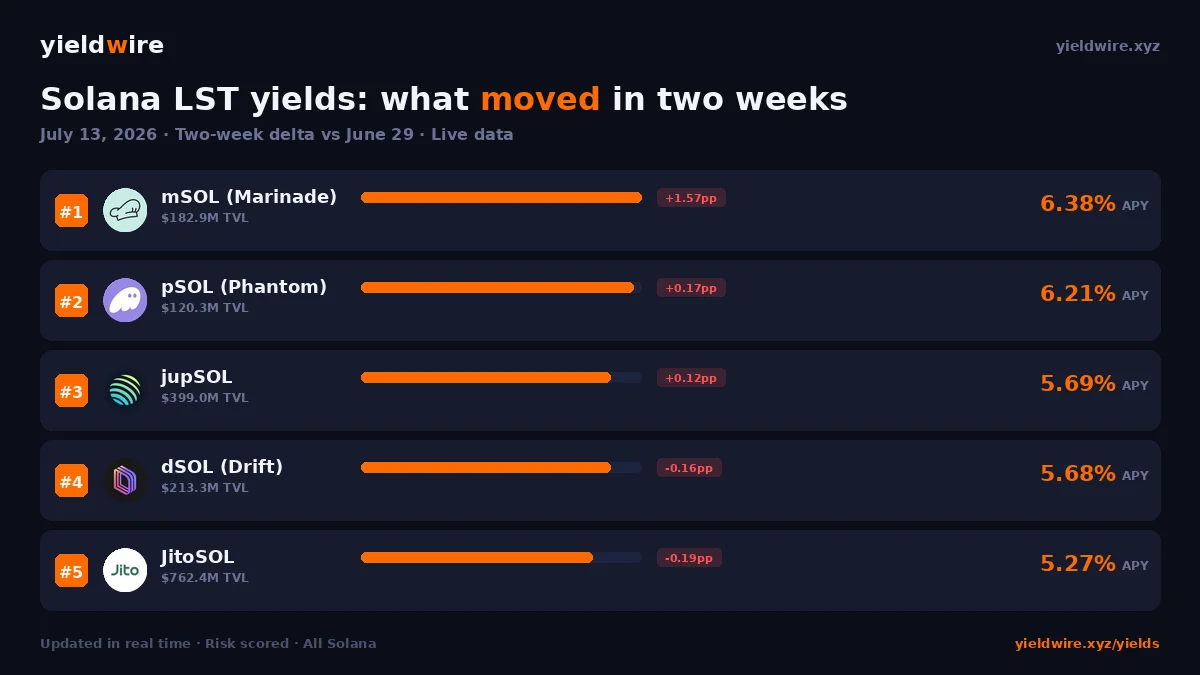
| mSOL (Marinade) | 4.81% | 6.38% | +1.57pp | $182.9M |
| pSOL (Phantom) | 6.04% | 6.21% | +0.17pp | $120.3M |
| jupSOL | 5.57% | 5.69% | +0.12pp | $399.0M |
| dSOL (Drift) | 5.84% | 5.68% | -0.16pp | $213.3M |
| bSOL | 5.33% | 5.60% | +0.27pp | $68.2M |
| JitoSOL | 5.46% | 5.27% | -0.19pp | $762.4M |
| dzSOL (DoubleZero) | 5.08% | 5.00% | -0.07pp | $399.4M |
| BNSOL (Binance) | 5.07% | 4.92% | -0.15pp | $769.8M |
mSOL is the story. A 157 basis point move in two weeks is enormous for a liquid staking token, where the underlying is the same inflation schedule for everybody. The base reward did not change. What changes an LST's realized rate is validator mix, commission, MEV capture, and stake pool composition. Marinade's number moved because its pool moved, not because Solana did.
Two-week LST prints are volatile by nature. A single epoch with unusual MEV or a rebalanced validator set moves the trailing figure. Treat 6.38% as a data point, not a run rate, and check whether it holds through the next few epochs before you rotate.
JitoSOL, the largest by TVL at $762.4M, drifted down 19 basis points and gained 3.0% in deposits. The pattern from lending repeats: size attracts flow, flow compresses rate.
One structural note. Sanctum's validator LST framework is now the single biggest bucket in the category at $1.11B, 23.7% of all Solana liquid staking. That is not one token, it is dozens of validator-issued LSTs that share a common reserve. The category is getting less concentrated at the token level and more concentrated at the infrastructure level.
The Orca pool that lost 107 points and no liquidity
Orca's SOL-USDC pool printed 149.41% APY on June 29. Today it prints 42.27%. TVL went from $24.5M to $25.3M, up 3.1%.
Nothing broke. Nothing was pulled. Two weeks ago the pool was collecting fees through a volatile stretch, and the trailing APY calculation annualized that volatility. Volume normalized. The number fell.
That is the entire lesson of LP yield in one row. Concentrated liquidity APY is a backward-looking fee rate dressed up as a forward-looking return. It tells you what the pool earned. It tells you nothing about what it will earn, and it says nothing at all about the impermanent loss you took getting there.
Use the calculator if you want to see what a 42% headline actually nets after a 15% divergence in the pair. The gap surprises people.
What to watch over the next two weeks
Does Kamino's supply come back? A 22% outflow from the main USDC market with rates barely moving is odd. Either it rotated to Jupiter, which grew 5.5%, or it left Solana lending entirely. The next print separates those two stories.
Does mSOL hold 6.38%? If it does, Marinade has done something structural to its validator set and the rest of the LST table has a problem. If it fades back to 5%, it was an epoch artifact.
Does the Jupiter-Kamino spread close? Right now Jupiter pays 4.46% and Kamino's main market pays 4.04% on the same asset, and Kamino is the one that just lost deposits. Rates that far apart in a two-protocol market usually converge or explain themselves.
Does anything break the 89% concentration? Loopscale at $78.1M is the only lender with enough momentum to matter, and it is still 13x smaller than the incumbents.
Full live rates across every pool are on /yields, and the top risk-adjusted picks are on /yields/highest-apy.
Data: DeFiLlama, pulled July 13, 2026. Two-week deltas measured against June 29, 2026. APY figures are trailing and change continuously. Nothing here is financial advice.
Track all Solana yields in real time
Compare APYs across lending, LP, and liquid staking protocols on the YieldWire dashboard.
Open Dashboard →