Fee Revenue vs Token Emissions: Measuring Protocol Sustainability
An APY made of real fees is durable. An APY made of printed tokens is a countdown. We pulled 30 days of fee and revenue data for the largest Solana protocols to separate the yield that survives an emissions cliff from the yield that does not.
Two kinds of yield, and only one of them lasts
Every APY on Solana is funded by one of two things. Real fees paid by people using the protocol, or new tokens printed and handed to depositors. From the wallet, both look identical. A number goes up. The difference only shows when the token program ends, and one of those numbers falls off a cliff.
Fee-funded yield is a share of real economic activity. Someone swapped, borrowed, or staked, paid for it, and part of that payment reached you. It scales with usage and it does not dilute anyone. Emission-funded yield is the protocol selling you its own token on a schedule. It can be large, it can bootstrap a pool from zero, and it always has an expiry. When emissions drop, the advertised APY reverts to whatever the fees alone can support.
Measuring which is which is not guesswork. DefiLlama publishes daily fees and daily revenue for most Solana protocols, and the gap between the two tells you how much of a protocol's yield stands on its own. Here is what 30 days of that data says, pulled July 9, 2026.
Fees, revenue, and the part that reaches depositors
Start with vocabulary, because the two numbers get confused constantly.
Fees are everything users pay to use a protocol. Swap fees on a DEX, borrow interest on a lending market, the management and performance cut on a staking product. Revenue is the slice the protocol keeps for its treasury or token holders. The difference, fees minus revenue, is supply-side revenue, which is the money that flows to the people providing liquidity or capital. That supply-side number is the fee-funded yield. It is what depositors earn before a single incentive token is printed.
Here are the eight largest Solana protocols by fee generation, with the split.
| Protocol | Category | 30d Fees | 30d Protocol Revenue | Supply-side (to depositors) | Protocol take |
|---|---|---|---|---|---|
| Meteora DLMM | DEX | $10.9M | $1.20M | $9.66M | 11% |
| Jupiter Perpetual Exchange | Derivatives | $9.37M | $2.34M | $7.03M | 25% |
| Sanctum Validator LSTs | Liquid Staking | $5.46M | $0.23M | $5.23M | 4% |
| Raydium AMM | DEX | $4.52M | $0.66M | $3.86M | 15% |
| Kamino Lend | Lending | $4.15M | $0.56M | $3.59M | 14% |
| Jito Liquid Staking | Liquid Staking | $3.21M | $0.00M | $3.21M | 0% |
| Orca DEX | DEX | $3.73M | $0.45M | $3.28M | 12% |
| Jupiter Lend | Lending | $2.86M | $0.14M | $2.72M | 5% |
The protocol take column is not a quality score. A low take means most of the fee flows straight to depositors, which is exactly what you want as a liquidity provider or lender. Jito keeps nothing at the protocol layer on its staking product, so every basis point of MEV and staking reward reaches jitoSOL holders. Jupiter Perp keeps a quarter, which funds the platform and its buybacks while the other three quarters pay JLP holders.
What matters for sustainability is that these are all real numbers. Nobody printed a token to produce them. This is the floor of what each protocol can pay indefinitely.
The organic base yield: what fees alone can support
Turn supply-side revenue into a yield and you get the number that survives any emissions cliff. Annualize the 30-day supply-side figure, divide by current TVL, and you have the fee-funded base yield.
| Protocol | Supply-side (annualized) | TVL | Fee-funded base yield |
|---|---|---|---|
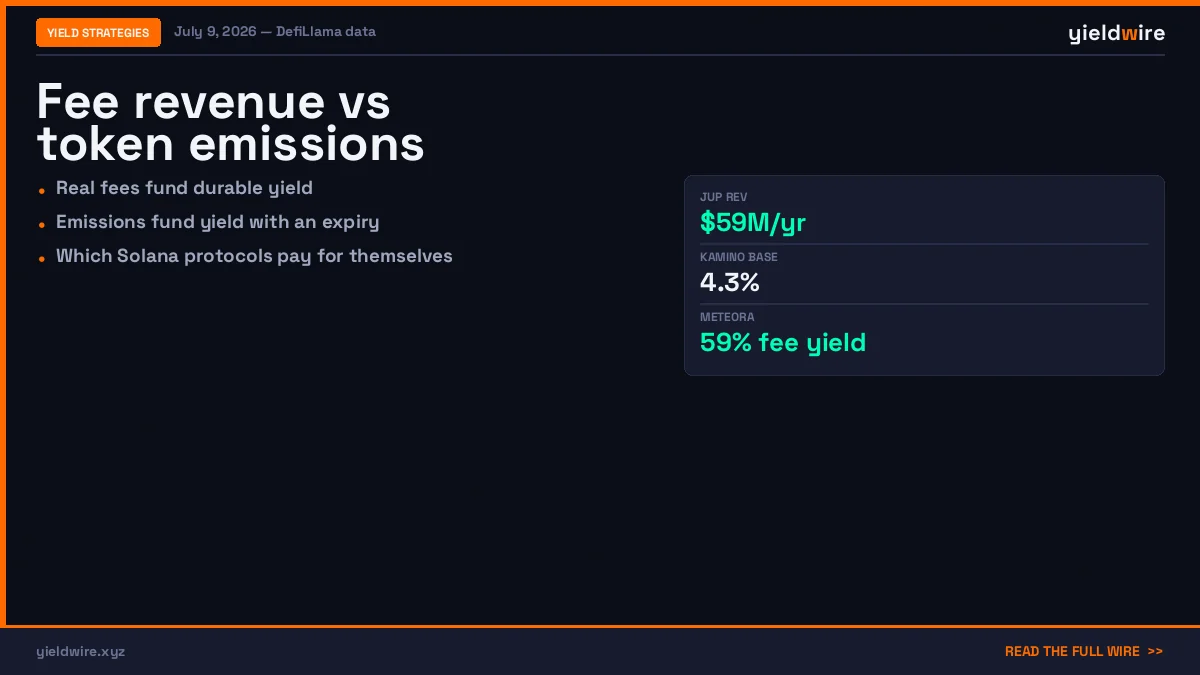
| Meteora DLMM | $117M | $198M | ≈59% |
| Orca DEX | $40M | $241M | ≈17% |
| Jupiter Perpetual (JLP) | $85M | $715M | ≈12% |
| Raydium AMM | $47M | $869M | ≈5.4% |
| Kamino Lend | $44M | $1,012M | ≈4.3% |
| Jupiter Lend | $33M | $991M | ≈3.3% |
A few of these need reading carefully. Meteora DLMM shows a blended 59% because concentrated liquidity earns fees on active price bins, not on idle TVL, so realized yields cluster around active positions and vary wildly by pool. The blended figure tells you the protocol produces enormous fee income relative to the capital parked in it, which is the healthiest possible signal for a DEX. Orca's 17% comes from the same concentrated-liquidity mechanism at a smaller scale.
The lending markets sit where you would expect. Kamino Lend and Jupiter Lend produce fee-funded base yields in the 3 to 5 percent range, which matches what a USDC lender actually sees on those platforms in a normal market. That is the point. When the fee-funded base yield lines up with the advertised APY, the yield is real. When the advertised number sits far above it, the gap is emissions or points, and the gap is temporary.
Where the printed tokens come in
None of the numbers above include a single incentive token. Layer those on and the advertised APYs change, sometimes a lot. The question is which protocols need the printer running and which do not.
The cleanest split is between protocols that fund themselves from revenue and protocols that fund growth by emitting supply.
Jupiter is the standout on the self-funding side. Across its perpetual exchange, aggregator, and lending markets, its annualized protocol revenue runs near $59M, and it routes a large share of that into buying back JUP rather than emitting new tokens to depositors. The aggregator alone keeps 100% of its fees as revenue, roughly $29M annualized, because there is no supply side to pay. A protocol earning that much real revenue does not need to dilute holders to sustain its yields. Its base yields are its yields.
Raydium runs the opposite model in one part of its business. Its AMM still pays RAY emissions on selected farms to keep liquidity deep in pools that fees alone would not fill. Those pools advertise APYs well above Raydium's 5.4% fee-funded base, and the difference is emission. It works as a growth tool. It is also the number that resets when a farm's emission schedule ends.
Kamino, Meteora, and Sanctum sit in the middle, running points and token programs on top of genuine fee income. Kamino's seasons hand out KMNO, Meteora distributes MET, and Sanctum's LST ecosystem layers CLOUD and validator incentives over the staking yield. In each case there is a real fee-funded floor underneath, the 4.3% at Kamino, the staking base at Sanctum, and a points-driven top layer that inflates the headline number until the program changes.
Jito is worth separating out because its staking yield looks incentive-free and mostly is. The jitoSOL return is MEV tips plus staking rewards, both real fee income, which is why its protocol take is zero and its supply-side capture is the full amount. JTO exists and has its own emission schedule, but the core staking product does not lean on it to produce the advertised yield.
How to read this before you deposit
The framework is simple once the two numbers are separate. Find the fee-funded base yield, compare it to the APY on the screen, and treat the gap as a clock.
If a pool advertises 18% and the protocol's fee-funded base yield is 4%, then 14 points of that number are emissions or points. That does not make it a bad deposit. Early emissions can be the best risk-adjusted yield on the chain, and points can convert into an airdrop worth more than any APY. It makes it a timed deposit. You are underwriting the token you are being paid in, and you should have a view on what happens when the schedule tapers.
If a pool advertises 5% and the fee-funded base yield is also around 5%, the yield is boring and durable. No schedule ends it. It moves with usage, not with a tokenomics decision, and it will still be roughly there in six months.
The trap is treating the two as the same asset. A 12% fee-funded yield from JLP and a 12% emission-funded yield from a farm are not the same trade, even though the dashboard prints the same number. One is a share of $85M in annual real fees. The other is a token distribution with an end date.
Where yieldwire fits
We track the fee and revenue split for every protocol we list, which is why our Security Score treats emission dependence as a risk input rather than a marketing point. A protocol whose yield is mostly fee-funded scores differently from one whose headline APY collapses the day emissions stop. You can see the fee-funded base and the advertised APY side by side on every listing in /yields, read the full revenue and admin breakdown on each protocol page, and model how an emissions taper changes your return with the yield calculator. The security rankings fold all of it into one grade.
Sustainable yield is not the highest number on the board. It is the number that is still there after the incentives run out. Fees tell you what that number is.
This is analysis, not financial advice. Fee, revenue, and TVL figures are 30-day values from DefiLlama as of July 9, 2026, and change daily. Annualized and per-TVL yields are estimates derived from those figures and will differ from realized returns, especially for concentrated-liquidity pools. Always verify a protocol's current numbers before depositing.
Track all Solana yields in real time
Compare APYs across lending, LP, and liquid staking protocols on the YieldWire dashboard.
Open Dashboard →